Well, you're not going to be making RF measurements up to 30 GHz without spending a bunch of money, so either path is big bucks.
Typically, Spectrum analyzers are used to do frequency domain measurements. You'll get a display of power vs frequency on the display. The controls in the SA are setup for relevant things, Center frequency, bandwidth, resolution bandwith, signal powers in dBm/dBc etc.
Digital oscilloscopes don't directly have sampling rates to directly sample a 30 Ghz signal, so they'll undersample and assume that the signal repeats. probably a safe assumption, although with no front end filters built into them, you've got dynamic range issues, as well as aliasing concerns that aren't present in a Spectrum Analyzer. You won't directly get spectral plots out of a Digital oscilloscope, you'll need to do an FFT on that. Now, that opens up a can of worms. FFT bin width/windowing function selection, etc. All stuff that can be worked through, but another question to deal with.
You won't get eye diagrams out of a spectrum analyzer, it's a useless measurement @ RF. That's a demodulated signal measurement.
Ultimately, if you want time domain data, then use an oscilloscope. If you want Spectral information, use a spectrum analyzer.
System bandwidth is a combination of probe bandwidth and oscilloscope input bandwidth. Each can be approximated by an RC lowpass circuit, which means delays add geometrically:
t_system^2 = (t_probe^2 + t_scope^2)
f_system = 1/sqrt((1/f_probe)^2 + (1/f_scope)^2)
This means that a 10MHz 'scope with 60MHz probes can measure sinusoids of frequency 9.86MHz with -3dB (100*10^{-3/20}%) attenuation.
When measuring digital pulse trains it's not so much the periodicity that matters, but the rise and fall times, as they contain the high-frequency information. Rise times can be approximated mathematically by an RC rise or a Gaussian rise, and are defined as the time for the signal to go from 10% of the difference between low voltage (logical 0) and high voltage (logical 1), to 90% of the difference. For example, in a 5V/0V system, it is defined as the time to get from 0.1*5V=0.5V to 0.9*5V=4.5V. With these constraints and some fancy math, one can work out that each type of characteristic rise time has frequency content up to about 0.34/t_rise for Gaussian and 0.35/t_rise for RC. (I use 0.35/t_rise for no good reason and will do so for the rest of this answer.)
This information works the other way, too: a particular system bandwidth is only able to measure rise times up to 0.35/f_system; in your case, 35 to 40 nanoseconds. You're seeing something similar to a sine wave because that is what the analog front-end is letting through.
Aliasing is a digital sampling artifact, and is also in effect in your measurement (aren't you lucky!). Here's a borrowed image from WP:
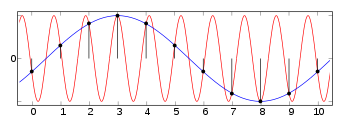
As the analog front-end is only letting rise times 35ns to 40ns through, the ADC sampling bridge sees something like an attenuated 50MHz sine wave, but it's only sampling at 50MS/s, so it can only read sinusoids below 25MHz. Many 'scopes have an antialiasing filter (LPF) at this point, which would attenuate frequencies above 0.5 times the sample rate (Shannon-Nyquist sampling criteria). Your scope doesn't seem to have this filter, though, as the peak-to-peak voltage is still fairly high. What model is it?
After the sampling bridge the data gets shoved into a few DSP processes, one of which is called decimation and cardinal spans, which further reduces sample rate and bandwidths in order to better display and analyze it (especially helpful for FFT calculation). The data is further massaged such that it doesn't display frequencies above ~0.4 times the sample rate, called a guard band. I would have expected you to see a ~20MHz sinusoid -- do you have averaging (5-point) turned on?
EDIT: I'll stick my neck out and guess that your oscilloscope has digital antialiasing, using decimation and cardinal spans, which basically means a digital LPF then resampling of an interpolated path. The DSP program sees a 20MHz signal, so it decimates it until it is below 10MHz. Why 4MHz and not closer to 10MHz? "Cardinal span" means halving the bandwidth, and decimation is often by a power of two as well. Some integer power of 2 or a simple fraction of it resulted in a 4MHz sinusoid being spat out instead of ~20MHz. This is why I say every enthusiast needs an analog 'scope. :)
EDIT2: Since this is getting so many views, I'd better correct the above embarrassingly thin conclusion.
EDIT2: The particular tool you liked to can use undersampling, for which a windowing analog BPF input is required for antialiasing, which this tool doesn't seem to have, so it must only have a LPF, restricting it to sinusoids of less than 25MHz even when using equiv. time sampling. Although I also suspect the quality of the analog side, the digital side likely does not do the aforementioned DSP algorithms, instead streaming data or transferring one capture at a time for brute force number crunching on a PC. 50MS/s and 8-bit word lengths means this is generating ~48MB/s of raw data -- far too much to stream over USB despite its theoretical 60MB/s limit (practical limit is 30MB/s-40MB/s), nevermind the packetizing overhead, so there is some decimation right out of the box to reduce this. Working with 35MB/s gives ~37MS/s sample rate, pointing to a theoretical measurement limit of 18MHz, or 20ns rise time, when streaming, though it is likely lower as 35MB/s is amazing (but possible!). The manual indicates a Block Mode exists for capturing data at 50MB/s 'til the internal 8k memory (cough) is full (160us), then sending it to the computer at a leisurely pace. I would assume that the difficulties encountered in designing a quality analog input were partially overcome by oversampling by 2X (extra half-bit accuracy), giving an effective sample rate of 25MS/s, maximum frequency 12.5MHz, and a 10% guard band ((0.5*25-10)/25), all of which could be reduced in the hand-tool itself. In conclusion, I'm not sure why you're seeing a 4MHz sinusoid as there are ways for this to happen, but would want to make the same measurement in Block Mode then analyze the data with a third-party program. I have always been hard on PC-based oscilloscopes, but this one seems to have decent inputs...
Best Answer
There are a few reasons for this:
Nyquist's theorem applies to reconstruction of sinusoidal signals of infinite duration from jitter-free, perfectly accurate samples. Real measurement device clocks have jitter and fixed frequencies, real samples have measurement error and real signals are not infinite sinusoids.
The measurement device (DSO) uses several staggered-clock, lower frequency parallel processes to achieve its impressive sample rate. Not all steps can be done in parallel, however, which can introduce bandwidth bottlenecks. These are largely a thing of the past in high-end equipment with the development of special-purpose ASICs, and fast GPUs and memory.
Several DSO manufacturers have found it more profitable to develop and manufacture a single or only a few high-end circuits, then introduce limitations such as lower frequency clocks and anti-aliasing filters for their mid and lower-end offerings, instead of developing and manufacturing a different design for each target consumer. The 'scope you were looking at may indeed be originally designed to measure higher maximum frequencies than stated, but is somehow handicapped.
Though I am far from an authority on the subject, I have heard the "10X" rule of thumb enough times to be repeating it here: an effective sample rate of at least 10X the signal frequency is required for intelligent reconstruction and analysis. As the listed sample rate on your school's 'scope is exactly that, I imagine the actual sample rate, taking into account the above considerations, is several times higher yet, but it all boils down to 10 samples of limited jitter and measurement error.