The problem is designing gain/volume/pan/balance/crossfade/mix controls with a smooth "law" or "taper"; the rate at which the audible volume changes as you turn them. (Described in The Secret Life of Pots and Changing the Law of a Pot, for instance.)
It's easy to make controls in which the gain changes very little in the middle and then swoops up at the top, for instance, but that's no good.
So I'd like to "draw" the circuit and then plot the gain/attenuation as a function of pot position, with either log or linear pots, and be able to vary component values and quickly see the effect on the gain function, in order to speed up finding the optimal layout/resistor values.
Currently I do one of the following:
- Simulate the circuit in TINA-TI. This sucks because:
- The pots only come in linear taper
- There's no way that I know of to plot something as a function of pot position. You can set the pot as a control object and vary the position in steps from 0% to 100%, but I don't know of a way to plot the gain. I just know you can plot the frequency response at each position, read the gains from the frequency response plot, and put them in a spreadsheet, which is very tedious.
- Calculate the curve in a mathematics program like wxMaxima or Python and plot it. This sucks because:
- It requires entering the gain equation by hand, which can be tedious and error-prone for certain circuits. You can't tell by looking at a complex equation whether it's right or not, and modifying it by adding resistors in parallel to existing circuitry is difficult.
- Again, plotting for a log taper pot is difficult. You'd have to enter the taper as a separate function which feeds into the gain function, and it still wouldn't match the real world exactly.
Any other ideas?
For illustration, here's a plot I made comparing linear pot, log taper pots, and linear pot with "pull-down resistor" to approximate a log taper. I'd like something that will plot the yellow curve, for different values of the pull-down resistor, so I can make it behave as closely as possible to the other curves, without having to enter an equation manually. Of course, my real applications are more complex, but this is an example of what I want to do.
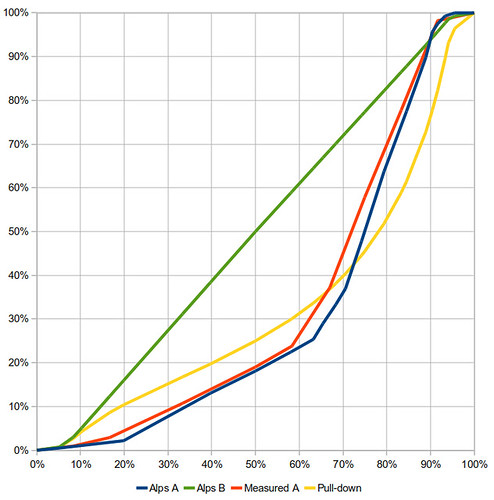
(Copied from Electronics Exchange)
Best Answer
It sounds like the built-in pot model you are using in your circuit simulator only lets you set the pot position once on the schematic, and then the position is constant during the simulation.
The Potentiometer Model at eCircuit shows how to build a model that acts like a linear pot that turns during the simulation. That's exactly what you need, right?
That model has a spice file that uses a piecewise linear source (PWL) that controls the position of the pot vs. time.
You could either use the "voltage" of VPOS as the X coordinate on your graph, representing pot position; or perhaps it's simpler to plot X as time and pick a PWL that linearly turns the pot proportional to time.
Then you run the simulation, and plot output voltage vs. time. Perhaps pipe in a square-wave at some audio frequency, and plot the output voltage vs time; then when viewing several seconds of simulation, you'll see a solid mass (the oscillations are too fast too see, more than 1 cycle per pixel width) that shows the envelope of the output waveform, and you can use either the top or the bottom as an estimate of the gain.
To simulate a non-linear pot, you could (a) edit the PWL line to turn the pot at a non-linear rate, but plot X as time, something like:
Or you could (b) build a model of a non-linear pot, and keep the PWL turning that pot at a linear rate, using something like
Both (a) and (b) give the same resistance-vs-time characteristics, right? Hopefully you can find some function or polynomial or a set of points to feed into PWL or TABLE that gives a close-enough approximation to the actual resistance of your real-world nonlinear pot.
I'm assuming you already have software tools that let you draw a circuit schematic and simulate it, that also accept SPICE models. If not, I'm pretty sure there is something suitable in the List of free electronics circuit simulators.
EDIT:
Or at the Chiphacker list of freeware SPICE simulators.
To plot AC signal gain as a function of pot position, first run a transient (time) simulation. Then plot the output (the voltage on the wire going to the speaker) vs. time. (Or you could plot it vs. the "turn signal", V(20) in the above code). You might have a pull-down menu option to do this; the old-school method is something like: