Your disk subsystem is unable to provide enough speed, that's why nginx is being locked on IO, because it's syncronous by default.
You may try to use aio: http://wiki.nginx.org/HttpCoreModule#aio - it would be solution to worker processes locking, so all other requests that are related to proxying or other asyncronus operations will work faster. But aio will not sightly speedup your downloads.
Consider adding more memory: increasing from 8 to 24 GB will improve linux vfs caching and it may give icredible results.
RAID6 is not good for static file serving. It shows good speed while single thread reading and performance is degraded on tens and hundreds concurent readings. There is nothing better than separate disks configured as JBOD. You may also try to use SSD for some "hot" content.
Before We Begin:
Having quality people will save you money. Just like
having a good Lawyer (possibly NSFW for swearing) or an accountant, having a quality SysAd will probably save you money, often by simply helping you to avoid costly mistakes. You may not have the money to pay for the expertise now, but as soon as you can, you should make that investment.
There is no simple, singular answer to this question. If you are one to ask this question, you must realize that this question is the core of a field that professionals invest years of study and practice in. The analogous question to a Developer would be "how do I write a Web Application?"; Sure, we could point you to a directions to installing Ruby-on-Rails and a RoR "Hello World". While that would 'answer the question', it wouldn't actually help you. This Q/A is an attempt to actually help you.
You should know:
Web Server Administration is a large topic, and it is intrinsically interweaved with many different disciplines. To do it well you will need a fundamental understanding of TCP/IP, your host OS, your WebServer Application, and some understanding of running the application stack.
Be prepared to read. A lot.
Identify your needs:
Requirements
- Are you running a plain, static website (maybe with some Javascript effects), or
- (more likely) are you running an application that happens to have a web interface?
- Do you have persistent data? (Do you need a database?)
- Are there user credentials involved? Is there another reason that you'd need the connection between the user and website to be secured? (SSL)
- Are you handling payments of any kind? In addition to having SSL requirements, there are additional considerations that you'll need to research (dependent on region). These will also vary depending on the payment processor that you use.
Identify your stack:
How are you going to write and run this?
- Platform (Windows, Linux, other Unix, etc)
- App requirements (Ruby/Rails, Python, Perl, PHP, .NET, etc, etc)
- Database (...)
- Caching? (Honestly, don't worry about this now; be aware that this solves some problems, and can create others. This is a problem of performance, and right now you're just trying to get started.)
Some of these choices will inform others. For instance, If you're running a .NET app, you probably want to use MSSQL and IIS; If you're running Ruby on Rails, you probably want a Linux server; etc...
Get to Know your Product:
Now that you've decided on what your stack will look like, you need to get to know it. This is where you should spend most of your time. Searching for "Configure [product]" or "[product] Admin Guide" should get you plenty of resources.
For instance, if you are running Apache on Ubuntu, you should absolutely read:
Look for similar docs, articles, blog posts for your stack.
Install the bare minimum:
There is a vast array of modules for Apache, but if you're not going to use PHP (for example), don't install mod-php.
It also should be stated here that you should avoid installing a GUI if it's a Linux server; GUI's use up a significant amount of system resources.
Securing the site:
- Ensure minimal permissions to function. This applies not only to the filesystem, but also to services and processes
- Keep server ports disabled for unneeded services. (Again, only install the minimum.)
- Restrict application interfaces to the internal environment (if, for instance, running a web application on the same server (such as Rails), restrict it to only listen to localhost)
In Closing:
This is only the beginnings of what you should do to get a site up and running. This doesn't even begin to touch the problems of maintaining servers or how to handle problems of scaling (should your project become successful), nor any of the other myriad issues that a knowledgeable SysAd will solve for you.
Best Answer
I don't think your disk is the issue. First nginx's ncache uses a disk store for cache. So, disk speed is going to be one potential cause of issues depending on how hot/cold your dataset is, however, I see no reason that you couldn't serve 100mb/sec with the hardware you've mentioned - especially if you're using nginx.
First thing I would guess is your # of worker processes was low, your worker_connections were probably way too low, and you probably didn't have your open_file_cache set high enough. However, none of those settings would cause a high IO Wait nor a spike like that. You say that you are serving <50k images and it looks like 1/4 of your set could easily be buffered by the OS. Nginx is surely not configured optimally.
Varnish handles the problem in a slightly different way using RAM rather than disk for its cache.
Much depends on your dataset, but, based on the data you've given, I don't see any reason for disk IO to have spiked like that. Did you check dmesg and the logs to see if one of your drives encountered some IO errors at the time? The only other thing I can think that might have caused that spike was exceeding nginx's filecache which would have caused it to have to go into a FIFO mode opening new files.
Make sure your filesystem is mounted with noatime which should cut a considerable amount of writeops off your workload.
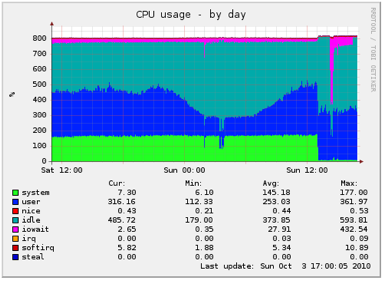
As an example of a machine that regularly handles 800mb/sec:
MRTG:
http://imgur.com/KYGp6.png
Dataset: