A good indicator for hacking activies or other attacks is the number of errors per hour. The following script returns the dates and hours that had more than 25 error codes returned. Adjust the value depending on the amount of traffic on the site (and the quality of your web application ;-) ).
SELECT date as Date, QUANTIZE(time, 3600) AS Hour,
       sc-status as Status, count(*) AS ErrorCount
FROM   {filename}
WHERE  sc-status >= 400
GROUP BY date, hour, sc-status
HAVING ErrorCount > 25
ORDER BY ErrorCount DESC
The result could something like this:
Date       Hour     Status ErrorCount
---------- -------- ------ ------
2009-07-24 18:00:00 404    187
2009-07-17 13:00:00 500    99
2009-07-21 21:00:00 404    80
2009-07-03 04:00:00 404    45
...
The next query detects an unusually high number of hits on a single URL from one IP address. In this example I chose 500, but you may have to change the query for edge cases (excluding the IP address of Google London for example ;-) .)
SELECT DISTINCT date AS Date, cs-uri-stem AS URL,
      c-ip AS IPAddress, Count(*) AS Hits
FROM  {filename}
GROUP BY date, c-ip, cs-uri-stem
HAVING Hits > 500
ORDER BY Hits Desc
Date       URL                                 IPAddress       Hits
---------- ----------------------------------- --------------- ----
2009-07-24 /Login.aspx                         111.222.111.222 1889
2009-07-12 /AccountUpdate.aspx                 11.22.33.44     973
2009-07-19 /Login.aspx                         123.231.132.123 821
2009-07-21 /Admin.aspx                         44.55.66.77     571
...
Ok, i realize i'm replying to a post that is more than a year old, but I know that some googler out there will find this information useful. Here is how I query IIS entries with the last X minutes (or hours, or seconds).
"select TO_LOCALTIME(time), c-ip, cs-method, sc-status, cs-uri-stem from <1> where TIME > SUB(SYSTEM_TIME(), TO_TIMESTAMP('00:05:00','hh:mm:ss'))"
This can be expanded to be the last day, month, year (assuming you are not using the -mindatemod option to logparser) by changing SYSTEM_TIME() to SYSTEM_TIMESTAMP() and editing the format specified in TO_TIMESTAMP().
It's also helpful to remember the logparser time format: 'yyyy-MM-dd hh:mm:ss'
-MBB
Best Answer
This is how you can do it with LogParser and Excel:
Step 1 Create the following query and save it as "Time taken graph.sql":
Step 2 Run the query and export results to CSV file:
Step 3 Open CSV file in Excel. I will use Excel 2010 as example.
Let's say your data sits in A1:B401 range:
Put "Time" in D1 cell. Put "Percent" in E1 cell. Fill time in D column with series starting from 0 to 5 with step 0.1:
Step 4 Put the following formula into E2 cell (you will need to replace 401 with your value):
Copy the formula to all cells in E column that have corresponding time value. Set style to Percent by pressing Ctrl+Shift+%
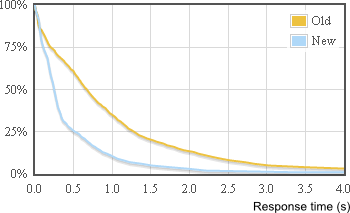
Step 5 Finally, build line graph based on the data in D and C columns: